As UK old crop wheat futures are now irrelevant, as prices are now determined by old-fashioned physical trading. Last Friday physical wheat for May delivery to a Hampshire mill was valued at £155/t, and a week later is £156/t.


November wheat futures closed at £153.75 last Friday and today closed at £151.95/t. Thus, there is a divergence between a slightly rising old crop where physical wheat is increasingly difficult to find, and falling futures on new crop where fears of supply are easing. Old crop wheat feels as if it is scarce or as if remaining pockets are held in strong hands as flour and feed millers continue to mainly trade on a spot basis meaning prices are well supported as supplies diminish. Increased UK import activity from the EU certainly indicates a similar story, but the indications are that this too is less available, as import prices are still too expensive an option compared to domestic sources. The lift in old crop physical wheat prices has occurred earlier than last year by several weeks, and in our humble opinion, is unlikely to ease until harvest replenishes stocks. Recent DEFRA data indicates that the 2017 crop was about 350,000t lower than previous estimates, and with a similar (smaller) crop expected for this coming harvest, this suggests that we will again be a net importer in 2018/19; so we may again see the UK act as an island market where prices are dictated more by currency and political developments than the impact of global wheat futures market. Whether we experience the same North-South divide in pricing (due to haulage rates) is a subject of debate.
The impact of this week’s USDA report was less than some predicted worldwide on the wheat market. If Chinese wheat stocks are excluded, then global wheat stocks have declined by 12.5%; the reasoning is that Chinese wheat stocks will never be offered onto the International markets. The US expects to harvest the smallest winter wheat crop in a decade following the droughts and this year’s low prices may push some farmers to grow alternative crops. As Russian wheat exports have grown over the past decade, the importance of US wheat exports has declined. The US National Agricultural Statistics Service forecast the US 2018 wheat crop at 1.19 billion bushels, down 6 percent from last year. Global wheat production is expected to fall 10 Mln T to 747.8 Mln T whilst demand is expected to reach over 750 Mln T for the first time; consequently global stocks will fall and makes the S&D look tighter.

Soya prices also fell prior to USDA report, the first indication of global supply and demand for 2018/19. Despite the effects of this year’s weather-related production problems (mainly Argentina) and trade disputes between China and the US, global soya production is expected to increase. Next year (2018/19) both production and consumption are expected to reach to new records as Argentina produces 17 Mln T more than this year’s crop failure which is matched by a 15.4 Mln T increase in global consumption. Soya bean imports to China are reported at 103 Mln T, but currently China currently continues to cancel orders from the US and is known to be encouraging domestic production; whether this will impact Chinese Organic soya exports is unknown.
Argentina continues to experience difficulties with rain storms hampering the soya harvest (following the drought in the growing stages); it is predicted that yields will drop further than current reports which leaves a lot of room for change in the soya markets.
Going the extra mile, and finishing by a country mile. The Romans measured distance in terms of paces, and 1000 paces became the Roman mile (mille passus or mille). In 29BC Agrippa defined a pace (the distance between successive falls of the same foot) as 5 Roman feet, thus a Roman mile was 5,000 feet [which today would be equivalent to 1,620 yards or 4,860 English feet]. By Anglo-Saxon times the Roman mille had become mīl and later myl.

By medieval times, the mile had become elastic; the Scottish mile was 1976 yards, the Irish mile 2240 yards, and the Welsh mile was 3 miles and 1470 yards long. The confusion to travellers, particularly caused by maps, meant that in 1592 the mile had to be standardised by Parliament to eight furlongs; or eight times the distance that could be ploughed by an ox without rest – a ‘furrow long’. As a furlong was 660 feet, then the British Imperial mile was standardised at 5280 feet, or 1760 yards (only 140 yards longer than the Imperial Roman mile).
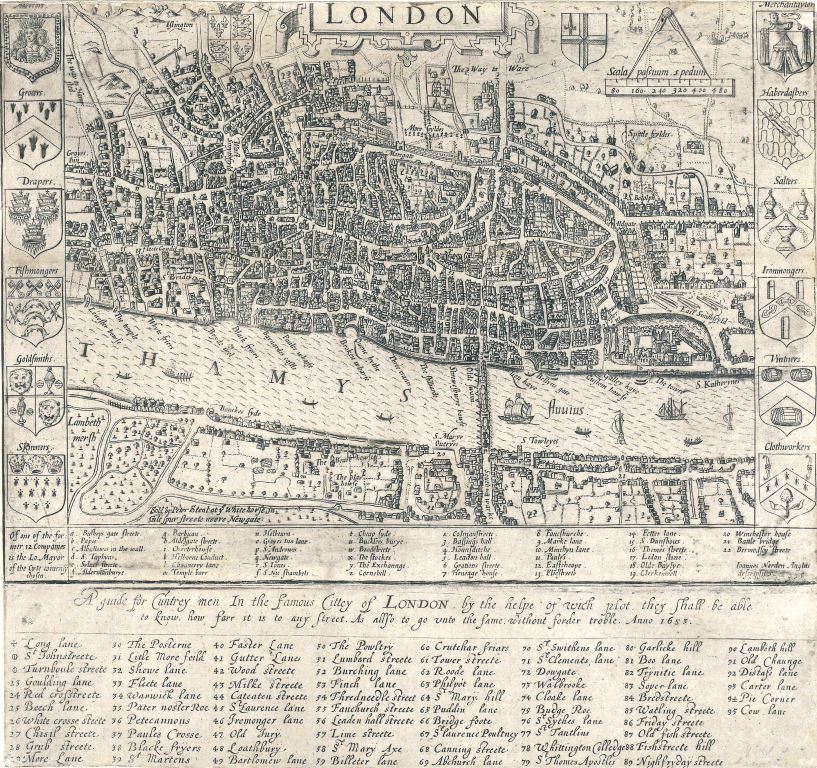
It appears that in 1593, cartographer John Norden saw an opportunity to design a London street map for non-city pedestrians in terms of a scale based on paces: A guide for Cuntrey men in the famous cittey of London by the helpe of wich plot they shall be able to know how far it is to any street. As allso to go unto the same without forder troble.